This page contains research, projects, writings, reports, and other work I wish to share hoping to inspire others.

Go Hoosiers!


Geography World Notebook

Est. October 2026

Live, interactive world map tracking personal studies in physical and human world geography. After frequent 7x5 inch notebook (pen, paper) page write-ups, the corresponding countries, territories, and maritime chokepoints are logged; covered countries are shaded green, and chokepoints are pinned. The map automatically updates from a CSV log through a Python and GitHub Actions pipeline.

This map makes no strategic or analytical claims; it is simply a record of disciplined study and an ongoing exercise in data pipeline design.
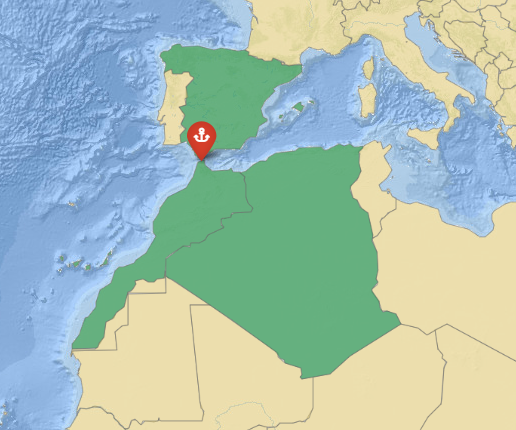

Geography World Notebook map

MLB Ballpark Factor Analysis

April 2026

End-to-end pipeline building the Swing Output Value (SOV) metric, analyzing park-level pitch mix, swing outcomes, and quality over 175,000 swings from 2023–2025 seasons. Includes Statcast pulls, per-season CSVs, downstream SQL analytics, and 7 reproducible notebooks.

Guaranteed Rate Field

March Madness Squares Are Not Random: A 40-Year Analysis

March 2026

An analysis of all 2,586 NCAA Men's Basketball Tournament games from 1985 - 2025, examining which final score digit combinations appear most frequently and why the board is less random than it appears. Structure under randomness.

March Madness

Used Car Sale Price Prediction Model w/ Feedforward Artificial Neural Networks

December 2025

A supervised regression pipeline trained on just over 6,000 tabular listings to predict used-car sale prices. Workflow performs thorough cleaning and feature engineering on listing attributes, then trains feedforward neural networks using *TensorFlow* with regularization and learning-rate scheduling.

Used car sale price prediction model

Crucial Keys

November 2025

A mini-project focused on capturing and analyzing my daily keystrokes across lecture notes, emails, and everyday use, transforming raw input into structured visualizations through a custom-built data pipeline to better understand how data is stored and used in early machine learning workflows.

Crucial Keys heatmap visualization