MLB Ballpark Factor Analysis

Report By: Bryce Gelarden
April 2026
Back to Research/Projects
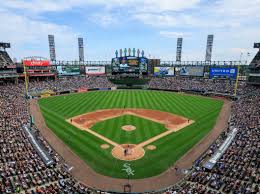
Guaranteed Rate Field

Research Question


Do ballpark environments in Major League Baseball explain variance in pitch type frequencies and pitch type contact quality across the 2023, 2024, and 2025 seasons in a post pitch-clock and defensive-shift era?

Notebooks

01 · Data Pipeline

First notebook establishes the data foundation for the study by importing raw Statcast event-level records, standardizing field names, and aligning pitch, swing, and ballpark metadata into a single analytical structure. Raw pulls were performed with the Python package pybaseball (using the Statcast endpoint) to retrieve all plate-level events across the 2023–2025 seasons; the goal was to make sure each observation is consistently tied to season, stadium, batter, pitcher, pitch type, and swing outcome before any interpretation is attempted.

Data filtered strategically, isolating true swing events and produce a clean, analysis-ready sample. The pipeline selects Statcast rows that represent swings (non-null pitch classification and descriptions consistent with swings or contact), limits the set to regular-season games and the 29 stadiums with valid park identifiers, and removes duplicate or incomplete records (for example, missing pitch type, missing launch metrics when contact-quality analysis requires them, or invalid park metadata). When contact-quality metrics were needed we additionally required exit velocity and launch angle to be present. These filters preserve the "juicy" observations while avoiding noisy or unusable rows that would bias park-level comparisons.

For downstream work, every cleaned swing-level table was exported to CSV — per-season CSVs plus a consolidated master CSV — so the same exact sample can be reloaded without repeating the network pulls. The pipeline also records provenance (query date, pybaseball version, and filtering steps applied) so results are easily audited and/or re-created later.

02 · Exploratory Analytics

Provides the first descriptive view of sampled data, identifying the major patterns in pitch usage and swing behavior before formal modeling. Designed to answer simple, yet essential questions: which pitch types dominate, how often contact occurs, how outcomes vary by venue, and whether seasonal sample is prepared for park-level inference.

Figure 1 shows that fastballs register a higher foul-ball frequency — likely because hitters must catch up to pitch speed and often foul pitches off while adjusting — while also showing a lower whiff (swing-and-miss) rate compared with many breaking pitches, since fastballs travel on a straighter plane and are less likely to induce chase or missed swings.

Figure 2 is an in-play scatter chart showing where the most common in-play balls fall across exit velocity (x-axis) and launch angle (y-axis). The plot emphasizes the dense clusters of typical contact — the hard line-drive band and the lower-velocity ground-ball cloud — and it provides a visual anchor for how contact quality maps to batted-ball profiles in different parks.

Overall, exploratory work establishes that sampled data contains genuine variation beyond random league-wide noise, which motivates the more formal park-adjustment work.

Figure 1 - Swing Outcome by Pitch Category
Figure 1: Swing Outcome by Pitch Category 2023-2025 Pooled Sample
Figure 2 - Exit Velocity vs Launch Angle
Figure 2: Exit Velocity vs. Launch Angle - In-Play Subset 25,000-observation Subsample

03 · SOV Construction

SOV (Swing Output Value) — a two-dimensional, data-driven measure of batted-ball quality combining exit velocity and launch angle into a single, interpretable score for park-adjusted comparison and modeling.


Elite Contact — Definition & Target

In Major League Baseball, elite contact is defined by the simultaneous combination of how hard and at what angle a ball is struck. Neither dimension alone is sufficient:

  • A ball hit at 105 mph into the ground (-10°) is wasted power
  • A ball hit at 28° off the end of the bat (65 mph) will die in the infield

SOV is built around a single elite contact target — the EV/LA coordinate that represents the peak of batted ball quality:

ParameterValueRationale
EV_TARGET105 mphWell into Statcast barrel territory
LA_TARGET28°Center of the home run producing sweet spot
EV_SCALESample EV stdev.Normalizes EV to equal footing with LA in distance calculation
LA_SCALESample LA stdev.Normalizes LA to equal footing with EV in distance calculation

Every observation in the SOV-eligible sample (n=63,625) receives a score based on its two-dimensional proximity to this target. Balls struck close to 105 mph / 28° score near 1.0. Balls far from that target in either dimension — weak contact, steep grounders, popups — score near 0.0.

The scale factors (respective standard deviations) ensure EV and LA contribute equally to the proximity score, preventing either variable from dominating simply due to its wider raw unit range.


Linear Mapping to [-1.0 , +1.0]

SOV = 2p - 1, where p is the empirical percentile rank of each observation.

This guarantees:

PercentileSOVContact Profile
0th-1.0Weakest contact in sample
50th0.0Median ball in play
100th+1.0Most elite contact in sample

No distributional assumption is made because SOV inherits shape entirely from the empirical ranking constructed in Section 3.


Note: SOV scores are written back to the SQLite database for downstream use.

Figure 3 - SOV Scoring Surface
Figure 3: Joint EV/LA Contact Quality Scoring Surface
Quick Note: The ellipse is wider horizontally (EV) and narrower vertically (LA), indicating the surface is more sensitive to launch-angle changes than exit-velocity changes — a small angle move can shrink the score faster than an equivalent EV change.

04 · Pitch Type Frequency (Layer 1)

This notebook is the first analytical layer and examines park-level pitch-type composition to establish whether venues deviate from league-wide baselines.


Chi-Square Goodness-of-Fit (GOF) — Park vs. League Baseline

Each stadium's observed pitch-type counts are compared against the league-wide pitch-type distribution using a Chi-Square Goodness-of-Fit test. The test evaluates whether a park's mix (fastballs, breaking balls, offspeed, etc.) deviates more than would be expected by chance given the overall league frequencies.


With 23 of the 29 parks having significant deviations from league-wide pitch type baseline, this confirms that ballpark environment is associated with meaningful differences in pitch type composition across the sample.

The 6 parks that do not have significant differences to league-wide averages are:

  • BOS (Fenway Park)
  • SEA (T-Mobile Park)
  • AZ (Chase Field)
  • CIN (Great American Ballpark)
  • SD (Petco Park)
  • PHI (Citizens Bank Park)

Chi-square magnitudes vary substantially across the significant parks — Milwaukee's chi2 = 95.994 is an extreme outlier, while St. Louis (chi2 = 60.21) ranks second but does not visually stand out in the Section 3 stacked-bar, suggesting its deviation may be driven by changes in multiple pitch categories rather than a single fastball-driven effect.

With ~5,970 swings per park, statistical power is high enough that modest deviations will clear p < 0.05. For this reason, chi-square magnitude (effect size) and the actual deviation patterns in Section 4 are used together to separate meaningful park tendencies from sampling noise.


Summary (Chi2): the GoF tests show statistically significant deviations in pitch mix across parks; magnitude differences (chi2) prioritize which venues warrant follow-up. Section 6's contact-quality work helps interpret whether those composition changes map onto meaningful outcome differences.

Figure 4 - Pitch Type Distribution by Park
Figure 4: Pitch Type Distribution by Park Compared to League Baselines

05 · Swing Outcome by Pitch (Layer 2)

Testing whether parks not only change pitch mix (Layer 1) but also shift the distribution of swing outcomes produced by those pitches.


Chi-Square Goodness-of-Fit (GOF) — Outcome Distributions

The same Chi-Square GOF framework from Section 4 is applied here to each park's observed swing outcome counts (e.g., foul, miss, weak contact, line drive, etc.) against the league-wide outcome baseline. The test evaluates whether outcome mixes differ from league expectations more than would be expected by chance.


17 of 29 parks deviate significantly from the league outcome baseline (p < 0.05) — fewer than the 23 of 29 in notebook 04, confirming that parks influence pitch mix more readily than they shift outcome distributions.

MIL is the standout result. Its chi2 for outcomes is 1.25 (statistically indistinguishable from league average), despite being the largest pitch-mix outlier in Section 4 (chi2 = 95.99). A park can throw a very different mix while producing near-normal outcomes; contact-quality analysis in Section 6 will help explain why.

Summary: the outcome-level GOF shows fewer significant deviations than pitch-mix GOF, suggesting that pitch selection shifts are often not sufficient on their own to change broad outcome distributions.

Bottom Line: parks have more influence over what gets thrown than over what happens when it does. Or, the higher number of parks deviating, the more systematic the effect.

Figure 5 - Swing Outcome Distribution by Park
Figure 5: Swing Outcome Distribution by Park Compared to League Baselines

06 · Contact Quality by Pitch (Layer 3)

Evaluating contact quality (SOV) at league and park levels, and examines how those effects vary by pitch category.


The pitch-type breakdown reveals that park SOV effects are not uniform across categories; the offspeed panel tells the most important story in this notebook. With ~2,200 in-play observations per park, confidence intervals are wide enough that most parks cannot be cleanly separated from the league median — the signal is clearest at the extremes.

COL leads at +0.0212 — Coors Field's thin air and hitter-friendly dimensions producing the strongest contact quality in the sample. SD sits at the bottom at -0.0368 — Petco Park suppresses contact quality.

MIL at -0.0319 with a CI that does not cross zero is the most analytically significant result of this section. The pitch-mix outlier of notebook 04 and the outcome-neutral park of notebook 05 is now confirmed as a contact-suppression environment. The sinkers and cutters at American Family Field are producing genuinely weak contact, invisible to whiff and foul rates but unmistakable in SOV. Only CHC, WSH, MIL, and SD have CIs that do not cross zero.


Section 4 breaks this down by pitch type to determine whether these park effects are universal or pitch-type specific. MIL at -0.1168 offspeed SOV deviation is the single most extreme finding in the entire project. American Family Field suppresses offspeed contact quality at a level no other park approaches.

SD sits below baseline on all three pitch-type panels — the only park showing consistent contact suppression across fastball, breaking, and offspeed. The fastball panel produces the tightest separation across parks; breaking and offspeed panels carry wider CIs by design (smaller per-park in-play samples).


Summary: park-level SOV tells a deliberately conservative story — extreme parks (COL, SD, MIL) stand out, but most parks overlap the league median within uncertainty. Section 4 and Section 5 together help explain whether composition or contact-quality mechanisms drive these differences.

Figure 6 - League-Wide Mean SOV by Pitch Category
Figure 6: League-Wide Mean SOV by Pitch Category - 2023-2025 Pooled
Figure 7 - Park-Level Mean SOV with CIs
Figure 7: Park-Level Mean SOV (error bars = 95% CI)

07 · Park Clustering (Layer 4)

Cluster analysis synthesizes the earlier layers by grouping parks on 12-feature profile after standardizing features to zero mean and unit variance.


Feature Scaling

Features are standardized so no single measure dominates clustering due to scale. Below are two core code steps used in the notebook:

from sklearn.preprocessing import StandardScaler
import pandas as pd

# X is the DataFrame of 12 features per park
scaler = StandardScaler()
X_scaled = scaler.fit_transform(X)
X_scaled = pd.DataFrame(X_scaled, columns=X.columns, index=X.index)
              
# Verify scaling: means ~= 0, stds ~= 1
means = X_scaled.mean().round(6)
stds = X_scaled.std().round(6)
print(means)
print(stds)
              

Choosing K: Elbow + Silhouette

Elbow Method inspects inertia (cluster compactness), and the Silhouette Score evaluating separation. Optimal K is chosen where inertia reduction flattens and silhouette peaks. Both criteria supported K = 5 for this run.


Five data-derived park archetypes emerge from the combined 12-feature profile across all three analytical layers:

ArchetypeParks
Swing & MissHOU, LAA, NYM, NYY
Contact SuppressionMIL
NeutralAZ, BOS, CHC, CIN, CLE, CWS, KC, MIA, PHI, SD, SF, STL, WSH
High Contact QualityATL, COL, DET, LAD, PIT
Mixed ProfileBAL, MIN, SEA, TB, TEX, TOR

MIL standing alone in Contact Suppression is the definitive clustering result of this project. No other park produces a sufficiently similar combined profile across pitch frequency, swing outcomes, and contact quality to share a cluster. American Family Field is analytically isolated — consistent with notebooks 04–06.


The Neutral cluster being the largest at 13 parks confirms that most MLB environments are genuinely average. Park environment matters, but mostly at the margins; outliers are the exception, not the rule.


Explore the full project ...

Check out the full data pipeline, notebooks, and additional materials on GitHub.

View Full Project on GitHub
Back to Research/Projects